About
Drug Target Profiler (DTP) is an interactive web-application for drug-target interaction network visualization, implemented for guiding drug repurposing, precision medicine and drug mode-of-action studies. The user-specified network is constructed based on integrated bioactivity data, namely dose-response measurements (IC50, EC50, XC50, AC50, Kd, Ki, and Potency). After entering the names of compounds or proteins of interest, DTP generates an interactive network layout with multiple visualization options for the user. A combined network visualization can be made for a maximum of 10 search entries. Users may also upload their own interactions data and make customized visualizations for compounds and targets beyond those that are available in the DTP database. Figure 1 shows the home page of DTP, where a list of compounds and genes names (in comma separated format) are entered in search box to construct compound-target network visualization. Compound names or target proteins are also autosuggested by DTP search option.
Browser requirements
DTP has been tested with standard browsers (Mozilla Firefox, Google Chrome and Safari).
While using DTC, if you encounter any problem please contact the development team.
User Information
DTP can be accessed without any user login, registration, or providing email address. Each user is provided an anonymous session through which user can search, filter or upload datasets. The data uploaded by the user is secure and private to the specific browser session, which expires after certain time. User has the possibility to bookmark the web address, close the browser, and revisit the address to resume the analysis.
Search Data
Users can get network visualization after searching compounds or proteins. Compounds can be searched using compound names (e.g. gefitinib), whereas target proteins can be searched using gene names (e.g. ABL1). Autosuggest may help users to complete compound/gene names after typing two first letters. A max of 10 entries can be searched at a time.
Search entries will be queried to our database that contains manually curated data comprising of 937,269 compounds; 5,077 protein targets (192 unique mutants), and 44,29,858 compound-target interactions(based on dose-response measurements).
For instance, after typing gefitinib, sunitinib, ABL1, ADRA1A in search box (Figure 1), DTP generates an initial network layout (after clicking Submit button). These search terms were chosen to show comprehensive network visualization from different protein families and compound categories.
Click to enlarge
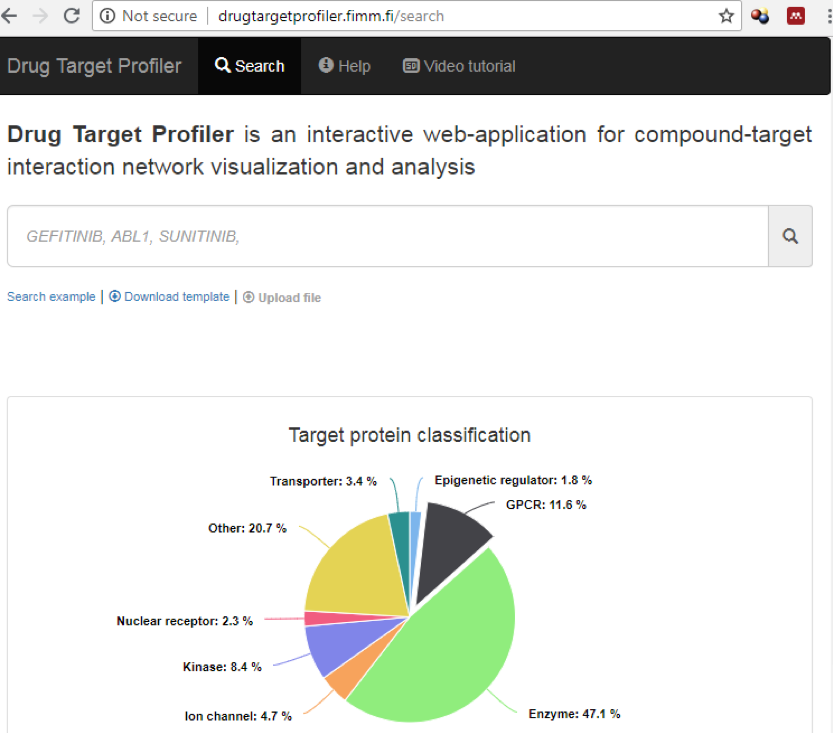
Figure 1: Searching the compound-target bioactivity data for Gefitinib, Sunitinib (compounds), and EGFR, ABL1, ADRA1A (targets).
After generating an initial visualization (Figure 2), the user can further customize it by interactive operations such as rearranging nodes, filtering and changing colors.
Click to enlarge
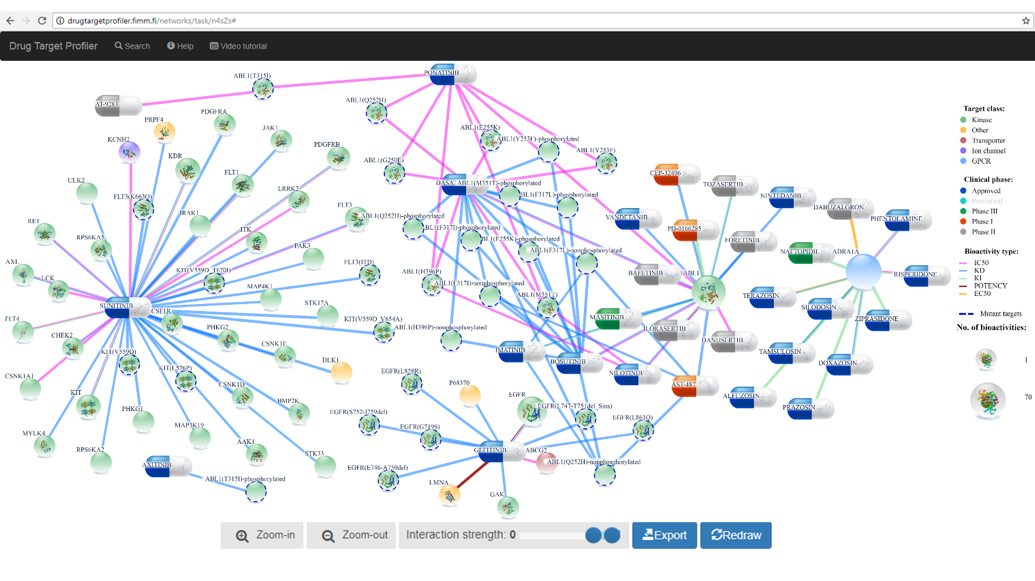
Figure 2: Compound-target interaction network visualization for Gefitinib, Sunitinib, EGFR, ABL1, ADRA1A.
Upload Data
In case the user-desired bioactivity data are not present in the database, the user can upload an Excel file containing at least compound name, gene name and interaction strength (between 0-1). User may also fill in other columns such as protein family (default: other), bioactivity type (default: unknown) and bioactivity value (default: blank), and compound phase (default: blank). After uploading the file, the user can further customize the generated network using options as described in the next section.
Customize visualization
This section shows how the user can customize the layout, do further filtering, edit the colors of legends and nodes, zoom and select interaction strength, and allows the user to export the visualization as a .png or .csv, as well as share the customizable visual workspace as a hyperlink.
Zoom
If user clicks on Zoom-in, then node and font sizes and legends will increase relatively, whereas the default position of nodes will remain same
Interaction score:
Network size can be grown by increasing the threshold for interaction score as shown in Figure 3. With the increase in network size, users might be able to see additional targets for compounds and additional compounds for target proteins. For display purposes, we set upper limit on number of links to 250. However, for further analysis, users can export all data in tabular format as Excel file for downstream analyses.
Click to enlarge
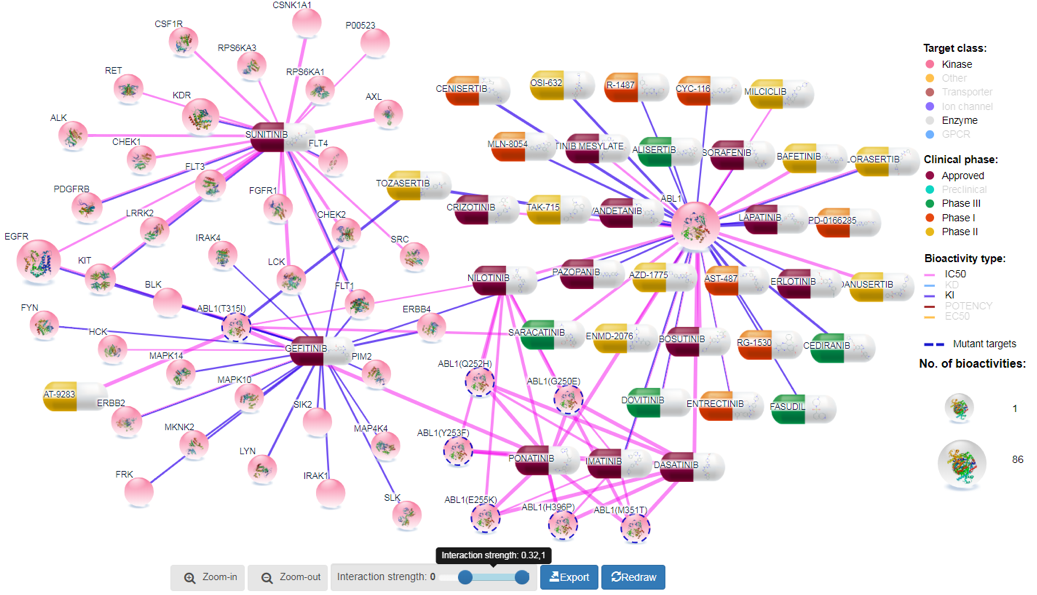
Figure 3::Changing the threshold for interaction score increases or decreases the network size.
Export:
Using the export option, the user can download the visual workspace (network figure or data) as .png file or a .csv file, respectively.
Click to enlarge
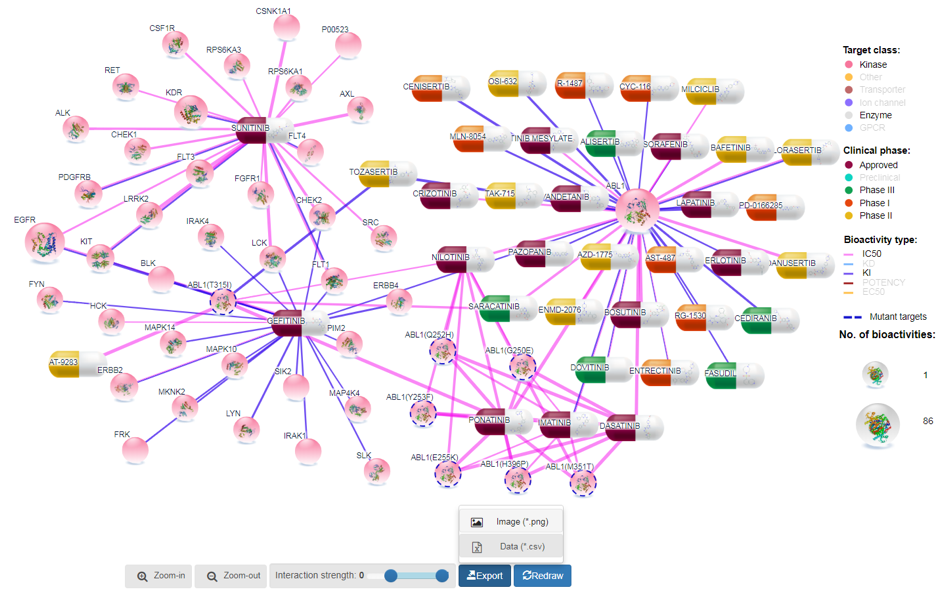
Figure 4: Exporting the customized figure or tabular data.
Target class:
Target proteins are divided into 8 families (GPCRs, kinases, nuclear receptors, transporters, enzymes, ion channels, epigenetic regulators, and other proteins). User can filter out unwanted protein families by single mouse click on the family name in the legend, and then slightly rearranging the network by clicking at redraw button (Figure 5).
Click to enlarge
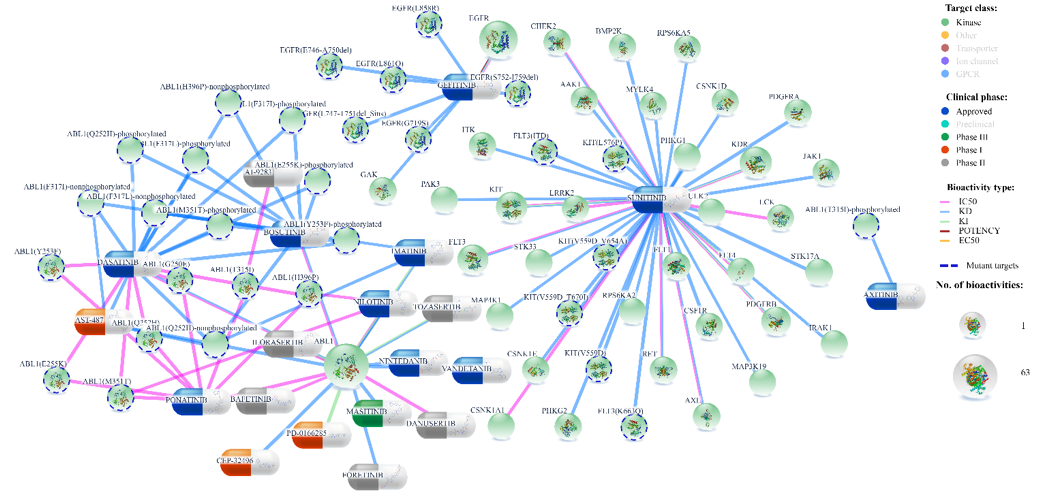
Figure 5: Filtering by target protein family.
Protein family colors can be changed by clicking the color (and selecting new color) on the left hand side of the family name legend. Opacity of the color can also be changed as can be seen on the right of the color palette.
Click to enlarge
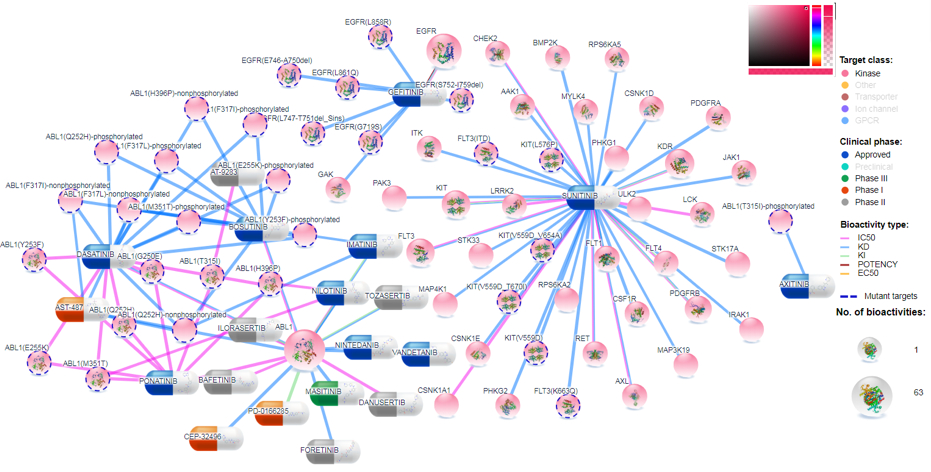
Figure 6: Protein family colouring.
Clinical phase
Compounds are divided into 5 categories based on their clinical development phases: Preclinical (by default it is off, but user can include it by clicking on the legend), Phase I, Phase II, Phase III and Approved. Colors for any category can be changed by clicking the color (and selecting new color) on the left of the family name legend as shown in Figure 8.
Click to enlarge
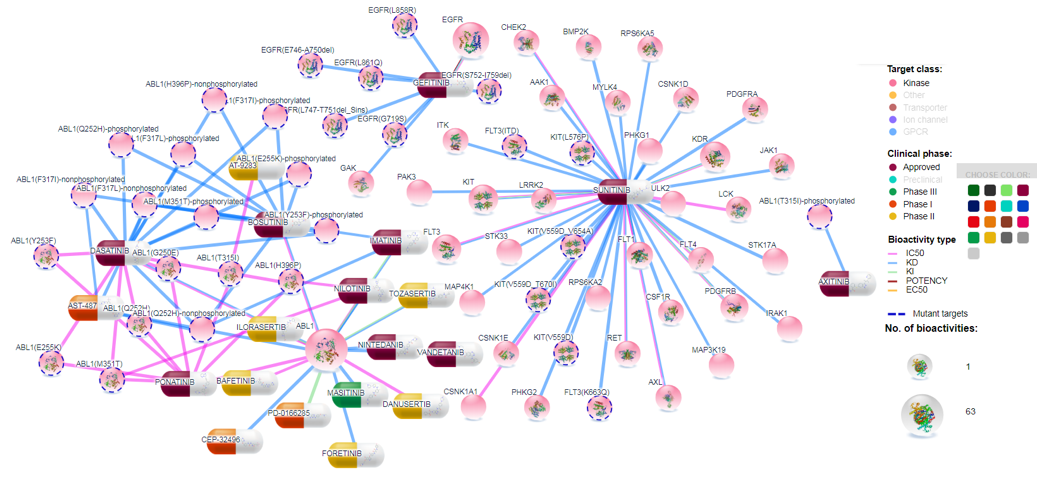
Figure 7: Changing the colors for compounds based on their clinical phase.
Bioactivity types
Bioactivity types are shown by the connection colors in the generated network visualization. Colors for bioactivity types can be changed by clicking the color at the left of the particular bioactivity legend. Bioactivity types can be filtered out by clicking the bioactivity type legend.
Click to enlarge
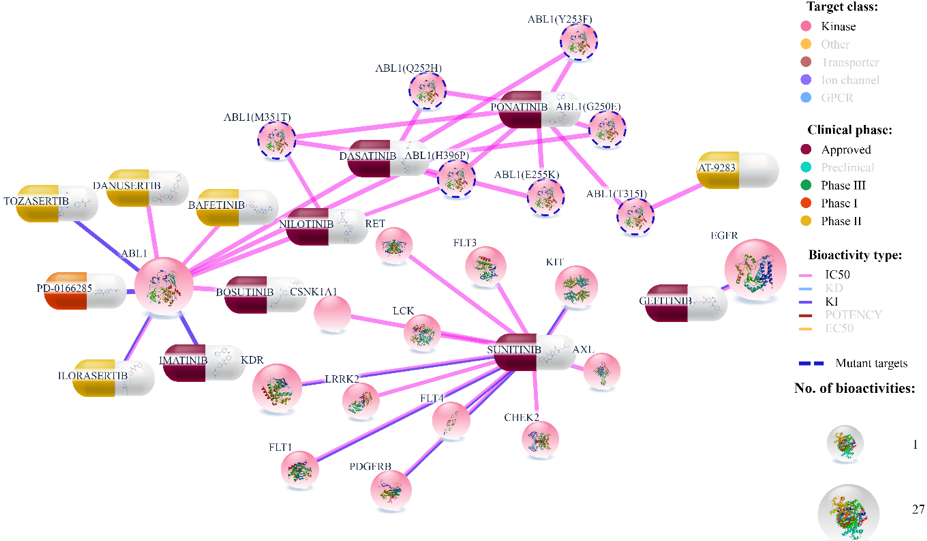
Figure 8: : Changing the connection colors based on bioactivity types.
Mutated targets
If user clicks on ‘Mutant targets’ in legend, only mutated targets will be left visible (and allthe wild type proteins will be filtered out). Mutated targets are distinguished from the wild types by dotted outline across the protein node in the visualization. Color for the outline of mutated proteins can also be changed.
Click to enlarge
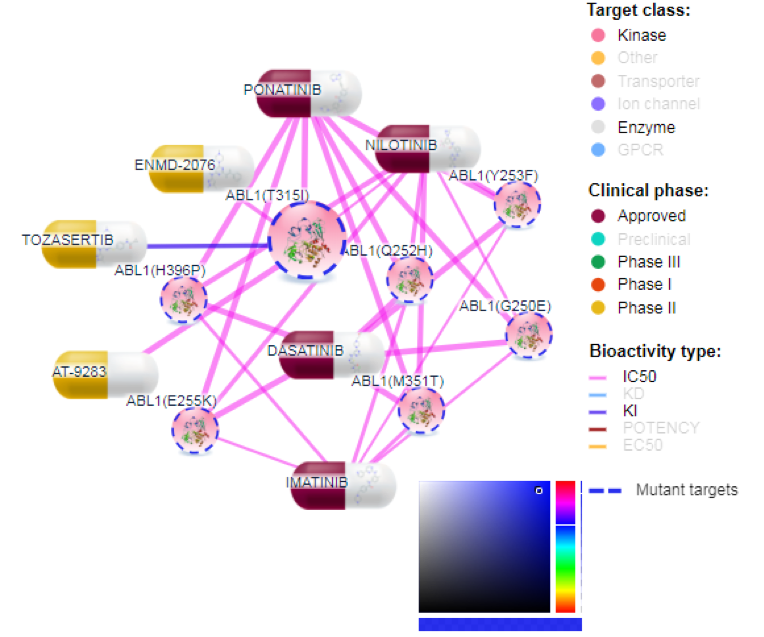
Figure 9: Filtering out all the wild type targets.
Network orientation
After the initial optimal placement of nodes, users can further reorder the nodes by dragging the appropriate node (compound or target). Network can also be regenerated by clicking the ‘Redraw’ button. Similarly, legends can be moved as shown in Figure 10.
Click to enlarge

Figure 10: Rearrange nodes of the network.
Protein nodes
Upon clicking a protein target, the GUI shows the top-expressed cell lines across different datasets (such as CCLE and GDSC), 3D structure of the protein, protein-disease associations, and cross-links to ~20 public protein and genome databases (such as UniProt, PDB and Ensembl).
Click to enlarge
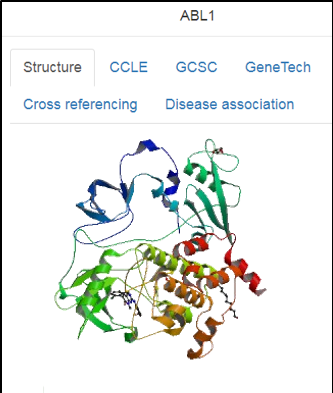
Figure 11::Clicking on protein node (ABL1) shows its structure, gene expression profiles, cross-referencing and related disease information.
Compound nodes
Upon clicking a compound node, the GUI shows the drug sensitivity scores for top-sensitive cell lines (across drug response datasets), clinical information (development phase, adverse effects, indications), cross-links to ~15 compound databases (such as ChEMBL, PubChem, DrugBank, and PharmacoDB) and 2D structure of the compound.
Click to enlarge
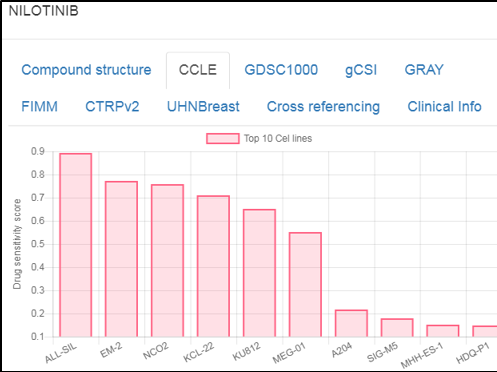
Figure 12::Click on compound node (Nilotinib) to see its 2D structure, drug sensitivity scores, cross-referencing and related clinical information.